Lost decades and half-centuries: gold turns 50
“I have directed Secretary Connally to suspend temporarily the convertibility of the dollar into gold or other reserve assets, except in amounts and conditions determined to be in the interest of monetary stability and in the best interests of the United States.”
Executive Summary
- It is 50 years since the United States severed the link between the US dollar and gold.
- Gold has performed strongly as an investment asset over this entire time period, and has outperformed stocks, bonds and cash since the turn of the century.
- While gold has lagged risk assets in the last decade, a range of metrics suggest hte precious metal may fare much better in the years ahead.
Despite the challenging path that US dollar gold investors have had to tread in the last decade, the 50-year anniversary of the closure of the ‘gold window’ represents a perfect time to take stock of the precious metal and its attributes as an investment.
On Sunday 15 August, we marked five decades to the day since then US President Richard Nixon made the above statement in a televised address to the nation on a Sunday night while markets were closed.
Many market historians would argue Nixon had little choice but to follow this course of action. Rising inflation throughout the 1960s had seen foreign governments line up to exchange their US dollar denominated assets for physical gold, with total US gold reserves dropping from over 20,000 tonnes in the mid-1950s to less than 10,000 tonnes by the end of 1970.
Irrespective of one’s view as to why this change was enacted, five decades later it’s clear that the suspension of the convertibility of the US dollar into gold has proved anything but temporary.
Since that day, the price of the precious metal has risen from below USD 40 to more than USD 1,750 per troy ounce at the time of writing. This works out to be as an annualised increase of just over 8%, with the return on gold and a range of traditional asset classes over multiple time periods to the end of 2020 highlighted in the table below.
Asset class returns (% per annum)
Time period
Gold (USD)
Equities
Cash
US Treasuries
5 years
12.2
15
1
4.8
10 years
3
13.8
0.5
4.4
20 years
10.1
7.4
1.3
4.9
30 years
5.1
10.6
2.4
6.1
40 years
3
11.4
3.9
7.8
50 years
8.3
10.8
4.5
6.9
Source: The Perth Mint, World Gold Council, NYU Stem historical market returns.
Despite the strong gold rally in the past five years, the market leading returns since the turn of the century, and a macro environment that many would expect to be favourable, it’s been a somewhat unhappy 50th birthday for the precious metal, with gold prices having fallen more than 5% in US Dollar terms this year.
This includes a dramatic sell off on Monday 9 August, which saw an almost USD 100 per troy ounce drop in a matter of minutes as more than 17,500 gold futures contracts (worth approximately USD 3 billion) were dumped into thinly traded markets, rattling the confidence of some gold market bulls.
In this article we’ll explore:
- Why gold has fallen in 2021 and why it hasn’t responded to higher inflation.
- Why gold has experienced a ’lost decade‘ in US dollar terms.
- What 50 years of price action tells us about the role of gold in a portfolio.
- Why the coming decade may be far more rewarding for bullion investors.
Why isn’t gold responding to the recent spike in inflation?
Between August of 2020 and July 2021, the Consumer Price Index (CPI) in the United States rose from 1.31% to 5.4% annualised. Despite the sharp increase, gold, which many expect to prosper when inflation is rising, has fallen by approximately 15%.
There are a multitude of factors which help explain this decline, from rising economic optimism as COVID-19 vaccines have been rolled out across most (though clearly not all) of the developed world, to an increase in the value of the US dollar, and a stabilisation/increase in real yields at the medium to longer end of the curve.
Perhaps more important than any of the above factors though are the following three:
Momentum exhaustion
It’s important to remember the gold price was trading below USD 1,200 per troy ounce in September 2018. In the two years that followed, the precious metal rallied more than 70%, culminating in the all-time high above USD 2,050 per troy ounce in August 2020.
With the exception of the super spikes in gold seen in the middle and at the end of the 1970s, the rally in the aftermath of the Global Financial Crisis (GFC) and the run up to the 2011 price peak, that 70% rally was one of the largest two year price moves seen in gold across the past five decades.
Irrespective of the asset class and the direction it’s heading in, momentum eventually kills itself. One could also argue part of gold’s rally in the first half of 2020 represented the market pricing in some of the expected increase in inflation, before it began to show up in official CPI readings.
Equity market strength
Despite the continued threat posed by COVID-19 and the uneven nature of the economic recovery, Wall Street is partying like a bachelor in Las Vegas, with the S&P 500 only a couple of percentage points away from doubling off the March 2020 low.
Strong earnings, a supportive (to say the least) monetary environment, and a lack of real yield in traditional defensive assets, has seen a veritable wall of money flow into risk assets, with research from Bank of America suggesting USD 580 billion was allocated to global equity strategies in the first half of 2021.
That’s more money than flowed in across the entirety of the 2008 to 2020 period. If this pace of inflows is sustained across all of H2 2021, they will exceed total inflows seen since the turn of the century.
Given this level of exuberance, it’s little wonder a safe haven asset like gold has lost favour, for now at least.
Market expectations that the recent inflation spike is transitory
The other major reason gold hasn’t responded more positively to the recent spike in headline inflation is the market’s belief (rightly or wrongly) that it will prove transitory. Investors seem convinced overall levels of annual headline CPI growth will head back towards a 2-3% range in the coming year, in line with current median CPI and 16% trimmed-mean CPI figures published by the Federal Reserve Bank of Cleveland.
Further evidence of the markets belief that the current inflation spike will prove transitory can be seen clearly in the table below, which highlights actual CPI levels at the end of July 2021, as well as market expectations for average inflation over the next 10 years, and the gap between these readings.
Annual change in CPI and 10-year breakeven inflation rate (%)
Annual change in CPI
10 year breakeven inflation rate
Gap - current CPI vs 10 year expectations
5.4
2.4
3
Source: St Louis Federal Reserve, 10 year breakeven inflation rate taken as at August 11.
This gap is almost unprecedented. Indeed, you’d need to go all the way back to the end of August 2008 to see such a large divergence between actual CPI levels and market expectations for average inflation over the next 10 years, as the chart below (which also shows the US dollar gold price) highlights.
Annual CPI minus 10-year breakeven inflation rate (%) and USD gold price

Source: The Perth Mint, St Louis Federal Reserve, World Gold Council
Equities fared horribly in the period that followed the inflation differential seen in Q3 2008, falling by 40% in the next six months.
Gold, on the other hand, went from strength to strength, rallying by more than 100% in the three years that followed, with an ultimate peak just below USD 1,900 per troy ounce on 5 and 6 September 2011.
A lost decade for gold
It is now almost exactly 10 years since gold peaked in its last cycle, with the price still below the levels seen for that short period in Q3 2011.
It is, of course, worth noting that:
- All the pain felt by gold bulls across the past decade was concentrated in the time period from late 2011 to the end of 2015, with gold falling 45% to bottom out at approximately USD 1,050 per troy ounce. Since then, the gold price is up more than 60% in US dollar terms, even allowing for the current pullback.
- Average prices across the last 10 calendar years (which arguably give a fairer perspective for all investors, rather than intra year highs and lows), show a much more modest pullback in gold of just 30% from peak to trough. They also suggest that gold, which has so far averaged just over USD 1,800 per troy ounce in 2021, is trading 15% above the average price seen in 2011.
- The lost decade is almost exclusively a US dollar-based observation, with gold performing more strongly in a range of other currencies over the period. This can be seen in the table below, which highlights gold’s price move in major developed market and consumer nation currencies, including Australian dollars, between 5 September 2011 and 6 August 2021.
Gold prices and performance (%) in multiple currencies
Currency
September 2011
August 2021
Performance (%)
United States Dollar
1,895
1,762.9
- 7
Chinese Yuan
12,101.1
11,402.3
- 6
Euro
1,342.8
1,499.1
12
British Pounds
1,176.9
1,271.4
8
Japanese Yen
145,858.1
194.491.9
33
Australian Dollars
1,791.8
2,397.2
34
Indian Rupee
87,155.8
130,725.6
50
Russian Rubles
55,888.7
129,534.6
132
Vietnamese Dong
39,476,640
40,418,887.5
2
Thai Baht
56,670
58,812.5
4
Turkish Lira
3,351
15,211.6
354
Source: World Gold Council
Despite the above caveats, it can’t be denied that it has been a tough 10 years for precious metal bulls investing in US Dollars. Several factors explain this lost decade, including:
Extreme outperformance leading into 2011
In the 10 years to end August 2011, the gold price in US dollar terms rose by more than 550%, while the S&P 500 price index was essentially flat. There were of course multiple contributors to this, from gold’s extremely low price relative to equities at the turn of the century, to the subprime crisis which ultimately led to the GFC, to the US Federal Reserve’s implementation of ZIRP and QE, more than a decade ago.
From a pure return perspective, outside of the huge gold market rally seen at the end of the 1970s, the precious metal had never had a longer, or stronger run relative to equities.
Long periods of outperformance are often followed by long periods of underperformance, no matter what asset class we are referring too.
Excess froth
By the start of the last decade, the macro case for gold was obvious.
Volatile markets, an uncertain economic outlook, a blow out in budget deficits and fears over higher inflation as the US Federal Reserve crossed the Rubicon into money printing (or not, depending on which version of Ben Bernanke you listened to) meant that gold had returned to the mainstream.
There are multiple indicators from that period that highlight this, including the fact that at one stage in 2011, GLD was not only the largest gold ETF on the market, but the largest of all ETFs in the United States. Granted, ETFs were not as popular a vehicle for investment 10 years ago as they are today, but GLD’s market leading position back in 2011 is still a sign of how popular gold was back then.
Meanwhile, a Gallup poll from August 2011 found 34% of American’s thought gold was the best long-term investment. Less than 20% of people voted for stocks and real estate at the time.
Investing in what is popular always feels safe. It doesn’t always turn out to be profitable, especially in the short to medium-term.
Low inflation
As it turns out, the market was right to expect very low levels of inflation in the period that followed the GFC, with CPI increases averaging barely 2% per annum in the 10 years to the end of 2020, the lowest figure for any decade going back 70 years.
Whether the low inflation seen in the last 10 years ’should‘ have happened given the monetary environment we have been in is beside the point. It did, and it’s been a key factor holding gold back.
Commodity bear market
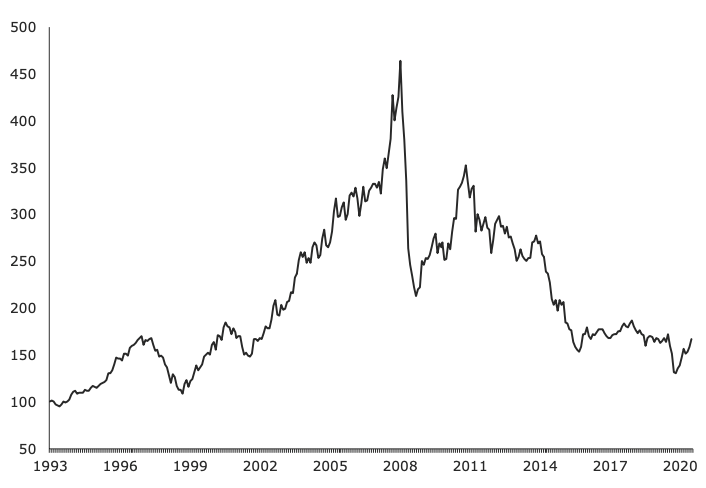
As we highlighted in an early 2021 research report for institutional investors, the past decade has been particularly unkind for commodity markets as a whole, with the Bloomberg Commodity Index dropping more than 60% between April 2011 and April 2020.
This can be seen in the chart below, which tracks movements in this index since the early 1990s.
Bloomberg Commodities Total Return Index
30 June 1993 to 31 December 2020
Source: Bloomberg
While gold has historically offered a range of portfolio benefits that a broader basket of commodities can’t replicate, a profound bear market in commodities still represents a headwind for the precious metal.
The rise of Bitcoin
While we think it’s impact on the gold market is heavily overstated by cryptocurrency advocates, especially those who (incorrectly in our view) claim Bitcoin is gold 2.0, it’s fair to say the rise of this nascent asset class has taken some of the attention, and quite likely some of the investment dollars, that might otherwise have found their way into the precious metal over the last 10 years.
What 50 years of market activity has taught us about gold
Despite the lost decade, gold can still play a valuable role in investment portfolios, with studies of market data over the entirety of the last 50-years demonstrating that the precious metal can provide:
Long-term growth
As highlighted earlier, gold has delivered capital gains of approximately 8% per annum over 50 years. It doesn’t deliver an income stream (not ideal, but a ‘known known’ as Donald Rumsfeld might have said), but there is no rule that says an investment can’t deliver all of its gains on the capital side of the ledger.
Despite the lack of yield, the total return delivered by gold has exceeded cash held in the bank, most segments of the fixed income universe, and the capital (if not total) return on equities.
An effective equity market hedge
As we have highlighted in previous research reports, gold can provide protection and growth for a portfolio, as it’s negatively correlated to equities when they fall, yet is positively correlated when they rise.
For Australian investors this is perhaps best visualised through the following table, which looks at 50 years of Australian equity market and gold price (unhedged in Australian dollars) return data. The table highlights the average return for both equities and gold in the calendar years equities rise, and in the years they fall.
Average annual equity market and gold price returns (%) in rising and falling equity market environments
Market environment
Average equity market move (%)
Average gold market move (%)
Equities rising
22.2
10.5
Equities falling
- 14.7
15.7
Source: The Perth Mint, Reuters
If history is any guide, and assuming low cash rates remain a feature of the investment landscape for some time to come, then gold is likely to be a much more effective defensive asset compared to cash going forward.
An asset that can prosper in high inflation or low inflation environments
While gold tends to do best in sustained periods of higher inflation, with average returns above 15% in years CPI rises by 3% of more, it has also historically delivered positive returns in low inflation environments. In the years CPI has risen by 3% or less, gold has still on average delivered gains of just over 5%.
Taken as a whole, 50 years of data tells us gold is a hedge against monetary turbulence irrespective of whether that turbulence expresses itself as sustained periods of higher inflation, or via a series of deflationary shocks.
Efficiency, given the gold market is large, liquid and low cost
Gold turns over more than USD 150 billion per day, making it more liquid than most equity markets (let alone individual stocks) and most bond markets. At more than USD 11 trillion in market value, the gold market is also larger than most equity and fixed income markets.
It’s for this reason gold can be one of the lower cost investments an investor can allocate too, evidenced through the fact that trading spreads and management fees for gold ETFs, including Perth Mint Gold (ASX:PMGOLD), are amongst the lowest of any ETF an investor can buy.
Ultimate stability, given its continued status as a reserve asset
Gold also clearly remains an important reserve asset for central banks, who collectively hold more than 35,000 tonnes of the precious metal, worth almost USD 2 trillion at today’s prices.
Its importance in this regard is only growing, particularly for emerging markets, with central banks as a whole having increased their holdings by approximately 20% (5,000 tonnes) since the GFC hit just over a decade ago.
The road ahead
While there are no guarantees, a solid case can be made that the coming decade will be far more favourable for gold and that the precious metal will remain a very useful asset to include in a portfolio.
Factors supporting this conclusion include:
Sentiment toward gold has shifted
In a complete reversal of the situation gold found itself in as it was heading towards USD 1,900 per troy ounce in 2011, gold is now largely unloved by investors, who are far more convinced that stocks and real estate are the safer long-term bet. This can be seen in the table below, which is drawn from Gallup poll data from 2011 to 2021.
Which asset do Americans think is the best long-term investment (%)?
Year
Gold
S&P 500
Real estate
Differential (Gold v Stocks)
Differential (Gold v Real estate)
2011
34
17
19
17
15
2012
28
20
20
8
8
2013
22
22
25
0
- 3
2014
24
24
30
0
- 6
2015
19
25
31
- 6
- 12
2016
17
22
35
- 5
- 18
2017
19
26
34
- 7
- 15
2018
17
26
34
- 9
- 17
2019
15
27
35
- 12
- 20
2020
16
21
35
- 5
- 19
2021
18
26
41
- 8
- 23
Source: Gallup polls
Indeed, on a relative basis, gold is as unloved as it has ever been relative to real estate, while it is still far less popular than equities are today.
Data like this doesn’t prove anything per se, but these are the kind of signals one would expect to see when a market is close to bottoming. By way of reference, gold today is essentially as popular as equities were back in 2011. The S&P 500 has rallied by more than 230% since then.
Extreme equity market outperformance
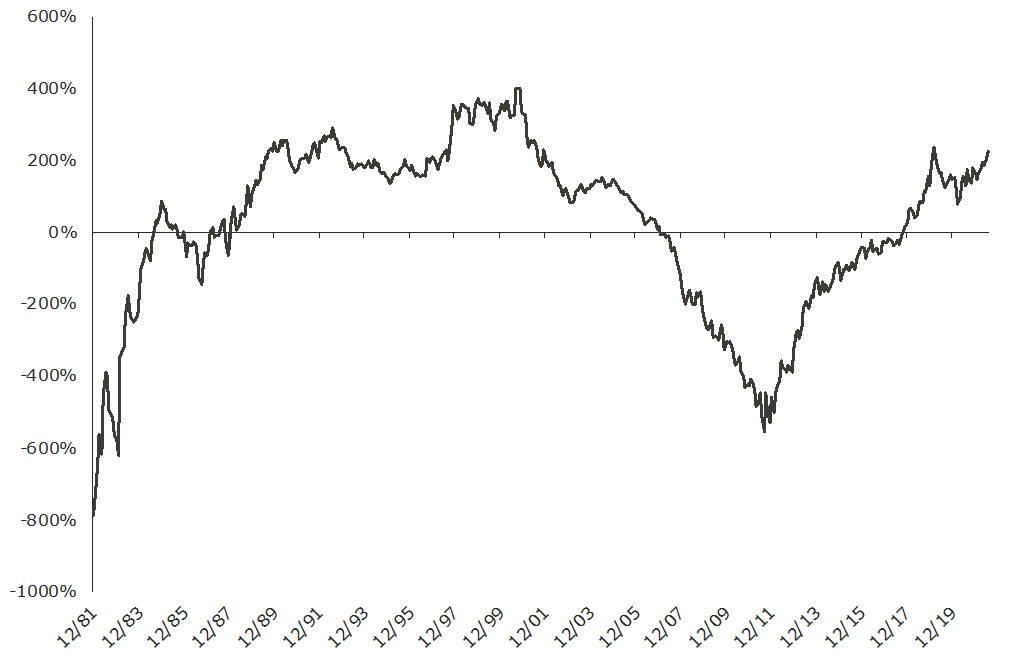
The relative performance of equities vs. gold is the complete opposite today as compared to Q3 2011, when gold’s lost decade began. Back then, gold had outperformed the S&P 500 by more than 500% on a 10-year basis.
By the end of last month, gold was underperforming by more than 225%, with the rolling 10-year performance differential between gold and equities seen in the chart below.
Rolling 10-year performance – S&P 500 (price index) minus US dollar gold
Source: The Perth Mint, World Gold Council
Good things happen to cheap assets, as the saying goes. Relative to equities, gold is about as cheap as it’s ever been on a rolling 10-year basis.
Traditional asset returns are likely to be constrained in the decade ahead
The next decade is unlikely to be anywhere near as rewarding for investors with portfolios concentrated in equities and fixed income assets.
This is something that institutional asset managers have openly acknowledged. The table below, which highlights a range of US financial market and economic indicators, illustrates how different the situation is today relative to Q3 2011, when gold’s lost decade began.
Note that some data is taken from the date closest to Q3 in either 2011 or 2021 - for example federal debt to GDP ratios are from end 2011 and the forecast for end 2021 from the Office of Management and Budget.
US financial market and economic indicators
Indicator
Q3 2011
Q3 2021
S&P 500
1,292.3
4,395.3
S&P 500 CAPE
22.6
38
S&P 500 price to sales ratio
1.1
3.2
US 10 year yield
2.82
1.24
US 10 year real yield
0.38
(1.16)
US Debt to GDP (%)
95.8
137.2
Federal Reserve Balance Sheet - USD $tn
2.9
8.2
Federal Reserve Balance Sheet - % of GDP
18%
36%
Source: US Office of Management and Budget, US Federal Reserve, Yardeni Research, Robert Shiller Online Data, Standard and Poor’s, United States Treasury.
The table makes it clear that investors are now paying almost double the amount of money to purchase a dollar of company earnings and almost triple the amount of money to purchase a dollar of company sales relative to a decade ago. Meanwhile, zero credit risk US Treasury bonds are now guaranteed wealth destroyers if held to maturity.
At a macro level, debt to GDP ratios are now far higher, as indeed they are all over the developed world, while the Federal Reserve balance sheet, both in dollar terms and as a share of the economy, has doubled relative to a decade ago.
The response to the pandemic has undoubtedly exacerbated these trends, but it is not their only cause, with the global economy already slowing down well before the vast majority of us had ever heard of COVID-19.
Given these factors, we wouldn’t be surprised to see gold outperform, or at the very least match the return delivered by equities in the decade to come, despite the fact sentiment toward the precious metal remains lukewarm at best today.
DISCLAIMER
Past performance does not guarantee future results. The information in this article and the links provided are for general information only and should not be taken as constituting professional advice from The Perth Mint. The Perth Mint is not a financial adviser. You should consider seeking independent financial advice to check how the information in this article relates to your unique circumstances. All data, including prices, quotes, valuations and statistics included have been obtained from sources The Perth Mint deems to be reliable, but we do not guarantee their accuracy or completeness. The Perth Mint is not liable for any loss caused, whether due to negligence or otherwise, arising from the use of, or reliance on, the information provided directly or indirectly, by use of this article.
