How common is it to own gold as a private investor?

When looking at demand in the global gold market, most analysis will focus on the breakdown between private investment demand (for bars and coins as well as ETFs), central bank buying, jewellery demand and industrial demand.
The following table breaks down above-ground stocks as at the end of 2019 across the key sources of demand.
Demand source
Tonnes held
Percentage of total
Jewellery
92,947
47.0%
Private investment
42,619
21.6%
Central banks
33,919
17.2%
Industrial demand/other
28,090
14.2%
Total
197,576
100%
Source: World Gold Council
As clear from the above, there are multiple sources of gold demand. At a household (or private sector) level, while gold is obviously known for its financial value, it also has emotional and cultural significance that varies from country to country.
As such, different people across the globe buy gold for different reasons, often influenced by an array of socio-cultural and macro-economic factors.
This article examines how widely gold is owned, looking at jewellery demand and private sector investment demand for bars and coins in some of the world’s largest countries and regions.
Private investment demand for gold
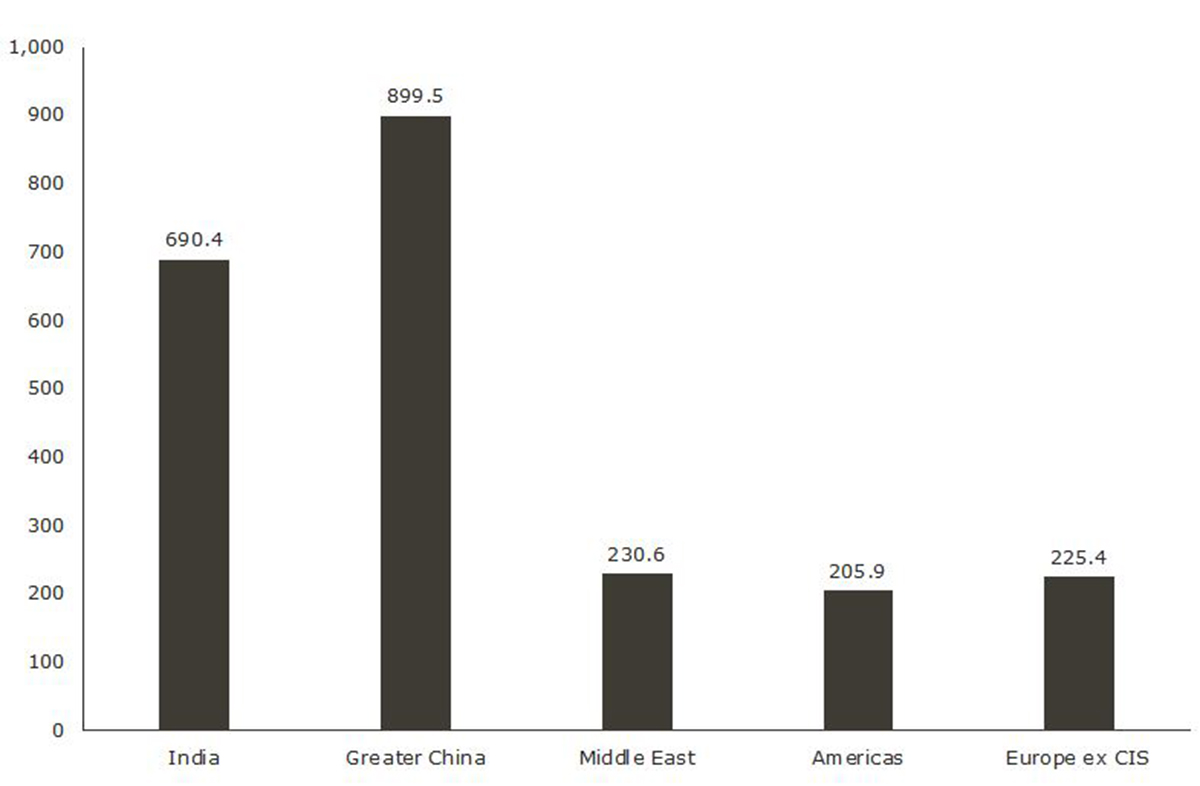
The chart below highlights total private sector investment demand for gold bars, coins and jewellery during 2019 in tonnes in India, Europe (excluding Commonwealth Independent States (CIS)), the Americas, the Middle East and Greater China.
2019 Private sector demand for gold (tonnes)
Source: World Gold Council
China and India clearly lead the way when it comes to private demand, accounting for 40% and 30% respectively of the demand seen across the above regions as a whole.
It is worth noting however that the above table does not account for gold ETF demand, which is overwhelmingly driven by investment in North America and Europe.
This can be seen in the table below, which shows the change in total gold ETF holdings in tonnes across key regions from the end of 2018 to the end of 2019.
Change in total gold ETF holdings (tonnes) 2018-19
Region
Change in tonnes held
Percentage of total
North America
204.75
45%
Europe
241.78
53%
Asia
-0.39
0%
Other
10.90
2%
Source: World Gold Council
If this ETF demand were captured in the data set that the above chart was drawn from, the disparity between India, China and the other regions would be less stark.
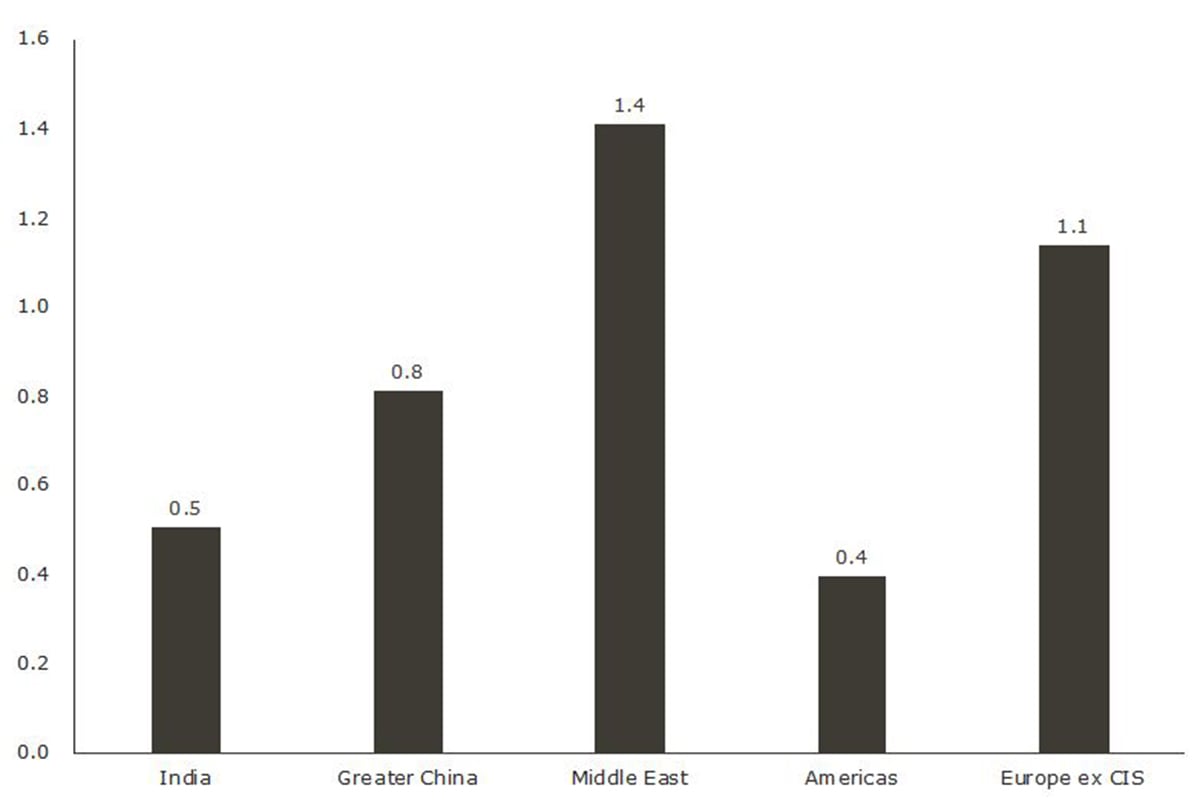
Another way to examine gold’s widespread ownership is seen in the chart below. It looks at gold demand on a per capita basis, which effectively equalises for the huge populations that live in China and India relative to other parts of the world.
2019 Private sector per capita demand for gold (grams)
Source: World Gold Council
When looked at this way, it is clear that on a per capita basis, demand for gold bars, coins and jewellery is far more even than the analysis based on pure tonnage would indicate.
Demand in the Americas is broadly in line with that seen in India, while in Europe and the Middle East, per capita demand exceeds that seen in China and India.
Takeaway: Gold is well dispersed
The key takeaway for investors is that ownership of gold is incredibly well dispersed around the world, with households and investors in all regions owning large amounts of the precious metal.
They also continue to provide ongoing demand for gold, which in turn should help support prices in the years to come.
resources
Above-ground stocks, World Gold Council
Gold Demand Trends Q3 2020, World Gold Council
