Gold performs when real cash rates are low

In today’s low cash rate environment one of the most topical issues for many investors is what to do with their cash holdings.
The income being earned on this cash is at record lows, with the Reserve Bank of Australia (RBA) cutting interest rates three times last year, ending 2019 at an all-time low of just 0.75%.
Given the latest set of Australian inflation data to end 2019 suggests prices across the nation are rising at 1.80% per annum (price rises for essential items like healthcare and utilities have increased by 4.40% and 5.40% per annum over the last decade), much of the money sitting in cash is losing value in real terms.
The question for investors about what to do with the cash in their portfolio will only be exacerbated if the RBA meets current market expectations and cuts rates to just 0.50% at some point in 2020.
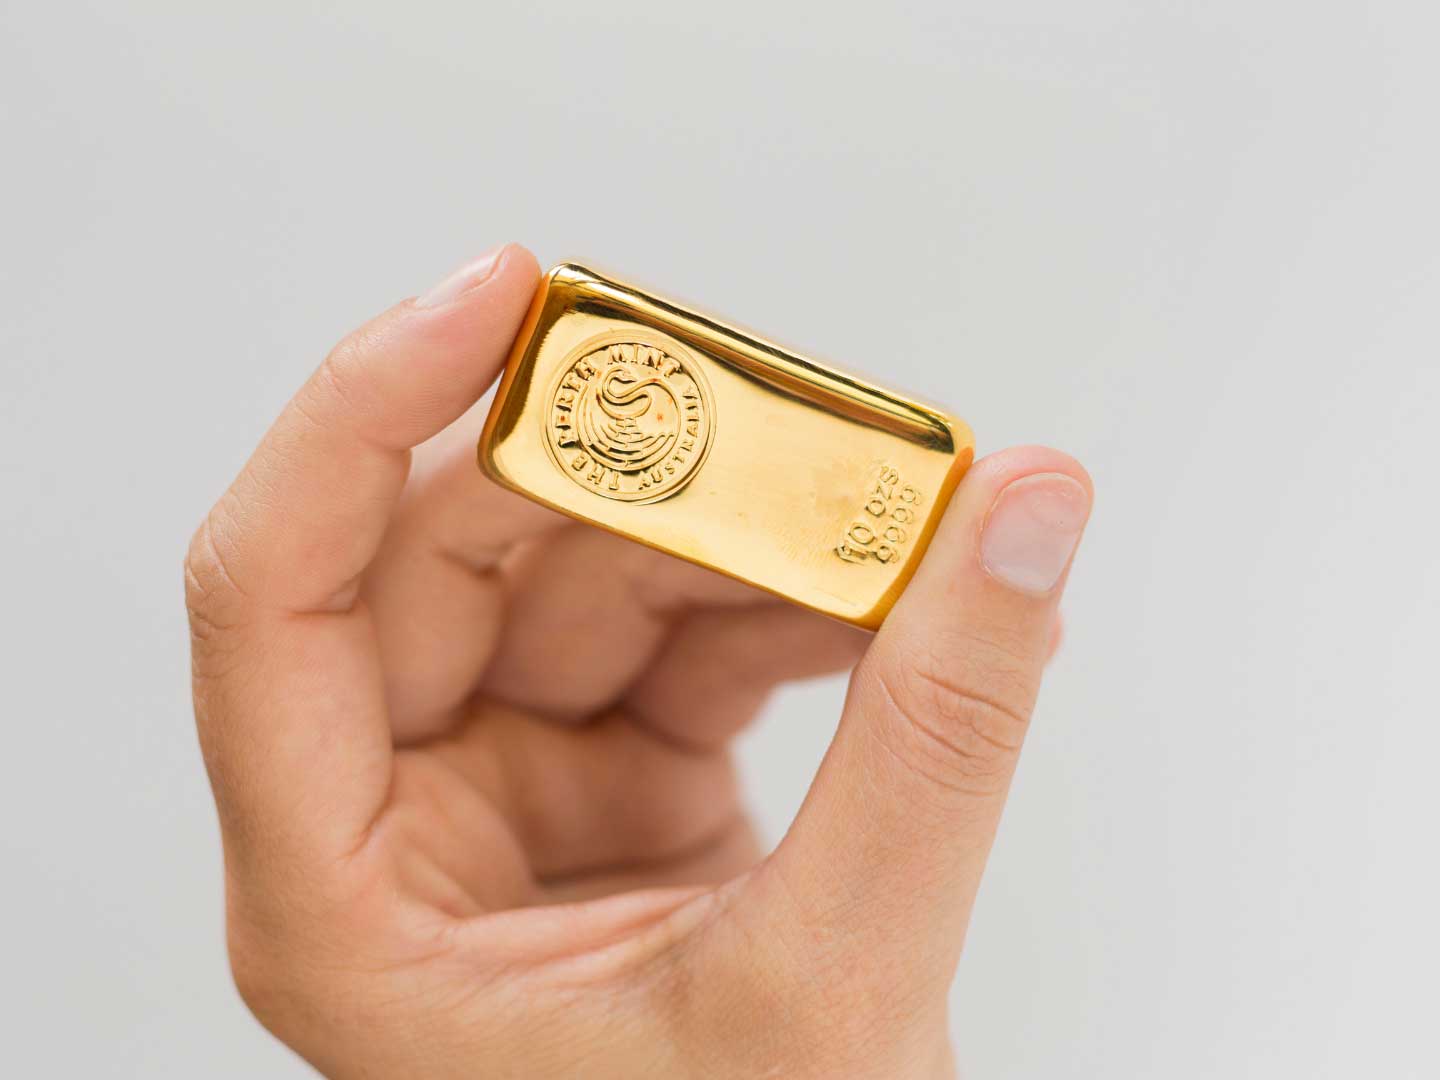
In this environment gold is an asset investors should consider, with almost 50 years of market history telling us the precious metal has typically delivered strong returns when real rates have been low.
In Australia between 1971 and 2019 there have been 27 years when real cash rates were 2% or higher and 22 years when they were 2% or lower. The table below highlights the returns on cash and gold, in both nominal and real terms, during these periods.
Real cash rate environments and asset returns (%) – 1971 to 2019
Real cash rate environment
Number of years
Years gold rose
Nominal cash return
Nominal gold return
Real cash return
Real gold return
Real cash rate above 2%
27
16
9.26
4.32
4.8
-0.14
Real cash rate below 2%
22
19
5.31
-0.82
20.28
14.14
Source: The Perth Mint, Australian Bureau of Statistics
The data tells us that when real cash rates are above 2%, gold recorded an average annual increase in nominal terms of 4.32%, with the yellow metal essentially flat in real terms.
However, in years when the real cash rate was below 2%, the price of gold rose by an average of more than 20% in nominal terms and by over 14% in real terms, with a calendar year increase seen in 19 of those 22 years.
Real cash rates are calculated by subtracting the official inflation figure from the RBA cash rate. As an example, if the RBA cash rate was 8%, and annual inflation was 5%, then the real cash rate would be 3%. If the RBA cash rate was 2% and annual inflation 3%, the real cash rate would be -1%.
This information tells us that the increase in the gold price of just over 18% in 2019 was entirely in line with historical patterns, essentially matching the average annual return the yellow metal has delivered in low to negative real cash rate environments.
Gold has not only performed strongly in absolute terms when real cash rates have been low, but on a relative basis as well, outperforming both stocks and bonds during the years when real cash rates were below 2%.
Two key drivers help explain why gold has delivered such strong absolute and market leading relative returns in low real rate environments.
- Low or even negative real cash rates are typically only implemented as a form of monetary stimulus when the economy is weak or softening. In such environments it’s natural that investors adopt a more defensive approach by seeking out safe haven assets such as gold.
- If the real rates one can earn from cash or short-term bonds are low, or even negative, then the opportunity cost of investing in gold is significantly reduced or completely eliminated.
These factors should be front of mind for investors trying to protect and build wealth today, as 10 to 15 year Australian government bonds currently yield less than 1.25% (as at end January 2020).
These yields suggest that the period of low to negative real returns on cash and cash-like investments such as term deposits, which gold has historically thrived in, may well continue for another decade or more.
DISCLAIMER
Past performance does not guarantee future results. The information in this article and the links provided are for general information only and should not be taken as constituting professional advice from The Perth Mint. The Perth Mint is not a financial adviser. You should consider seeking independent financial advice to check how the information in this article relates to your unique circumstances. All data, including prices, quotes, valuations and statistics included have been obtained from sources The Perth Mint deems to be reliable, but we do not guarantee their accuracy or completeness. The Perth Mint is not liable for any loss caused, whether due to negligence or otherwise, arising from the use of, or reliance on, the information provided directly or indirectly, by use of this article.


